San Francisco’s September Housing Market: Prices Rebound as Inventory Trails Last Year
Market Update

Market Update
Single-family prices return above $2 million, condo sales accelerate, and fall listings offer more choice within a substantially smaller pool of available homes.
San Francisco added listings in September, but the increase did little to close the inventory gap with last year. At month’s end, 657 single-family homes and condos were available, compared with 950 in September 2025. Meanwhile, closed sales across the two property types were almost unchanged: 394 this September versus 395 a year earlier.
That combination is the central story in this month’s data. A similar number of homes sold from a considerably smaller pool of available inventory, alongside higher median prices and shorter marketing times.
Metric | Single-Family Homes | Condos |
|---|---|---|
Median sale price | $2,054,000 | $1,316,500 |
Price change, year over year | +18.4% | +18.9% |
Homes for sale | 229 | 428 |
Inventory change, year over year | −25.2% | −33.5% |
New listings | 309 | 351 |
Closed sales | 184 | 210 |
Average days on market | 12 | 14 |
Average sale price above original asking | 31% | 10% |
Months of supply | 1.2 | 2.0 |
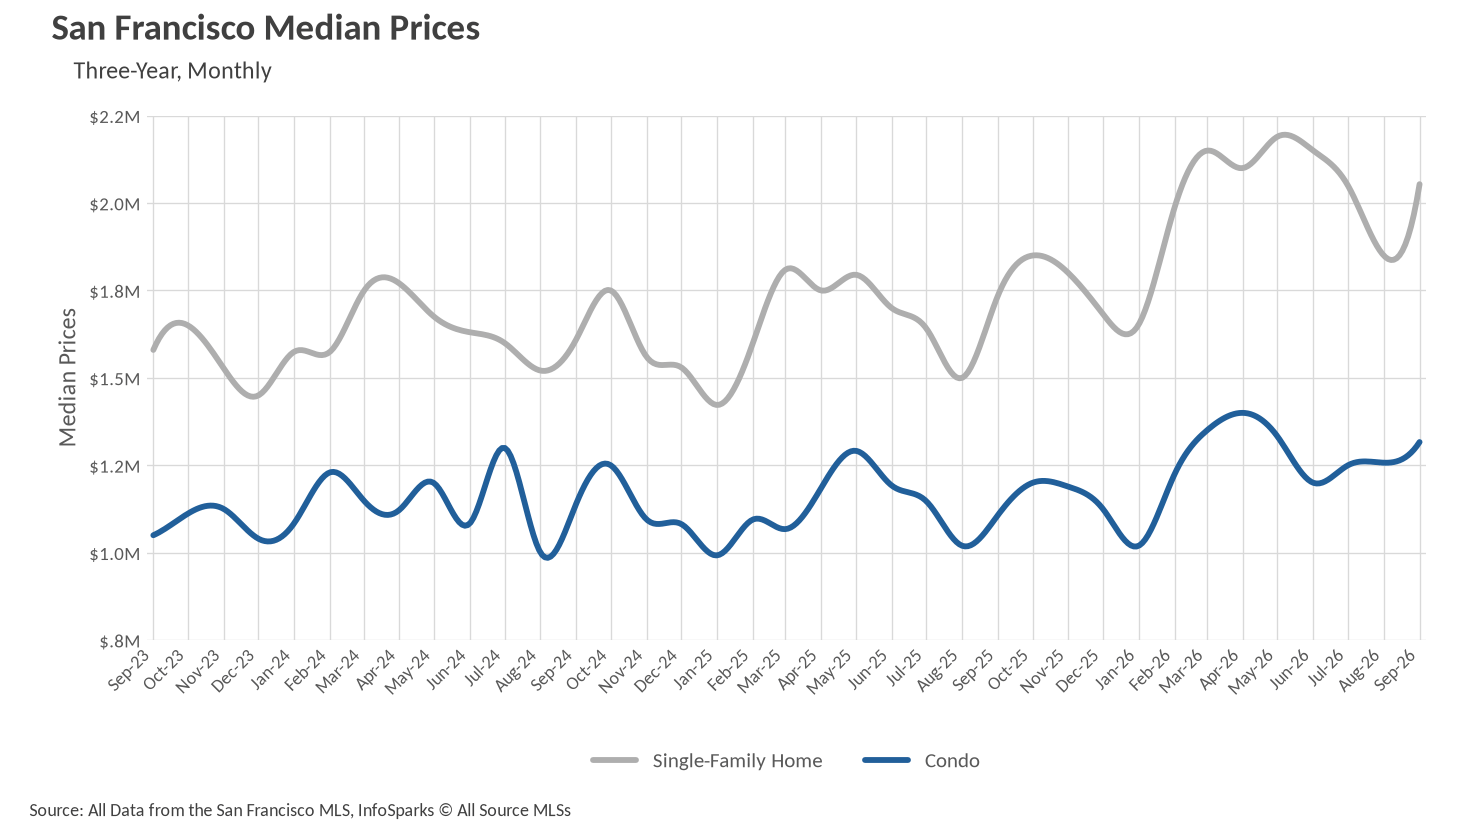
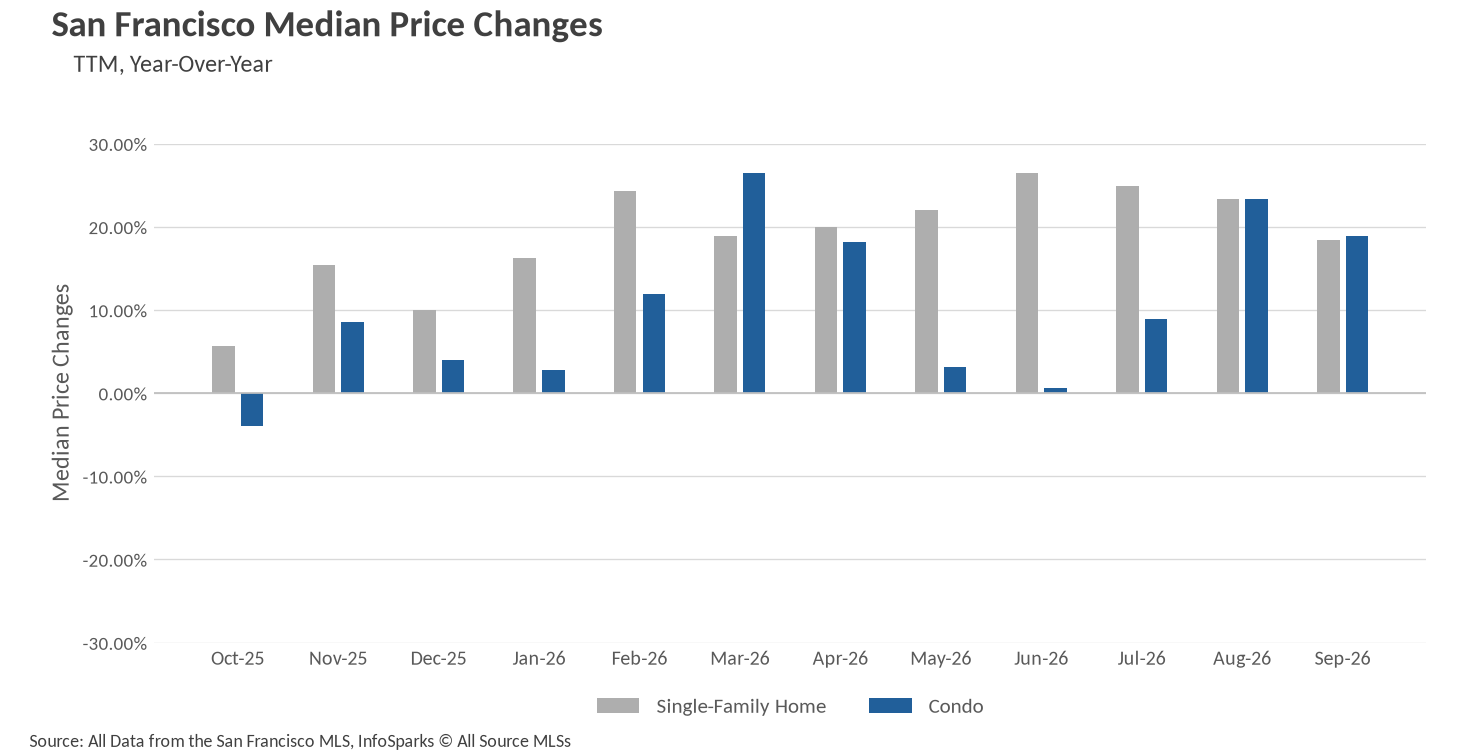
After falling to $1,850,000 in August, the single-family median sale price rose 11.0% in September to $2,054,000. That is 18.4% above the $1,735,000 median recorded in September 2025.
The condo median reached $1,316,500, up 4.7% from August and 18.9% from a year earlier. September marked the third consecutive monthly increase for condos, although the median remained below April’s $1,400,000 peak.
These are changes in the midpoint of homes sold, rather than a measurement of appreciation for an individual property. A different mix of sales can move the monthly median. The charts provide the longer view, showing both the seasonal fluctuations and the year-over-year comparisons.
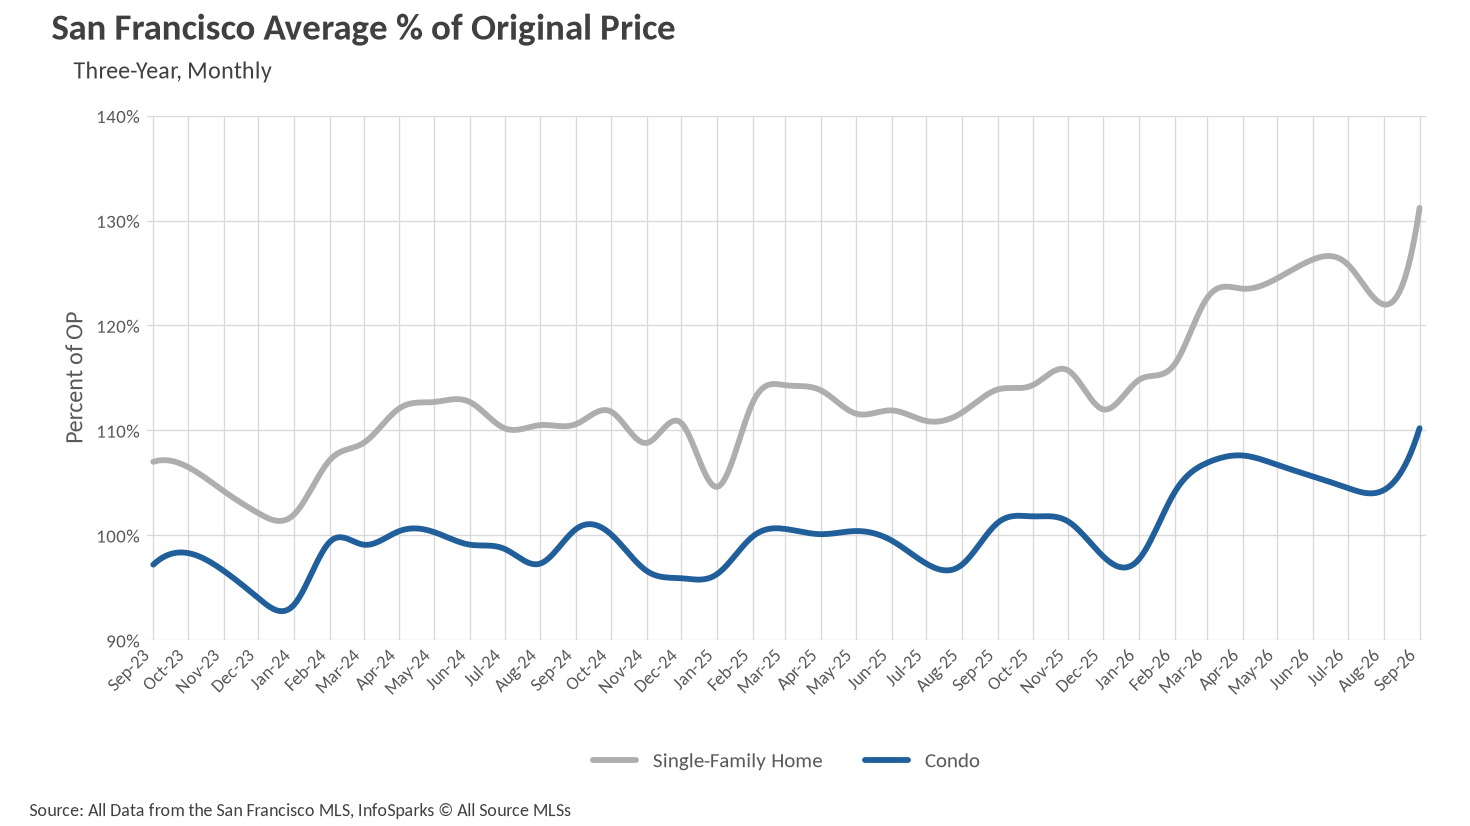
Single-family homes sold for an average of 31% above their original asking prices in September, compared with 14% a year earlier. Condos averaged 10% above original asking, up from 1%. Both readings were the highest in the report’s three-year series.
The distinction between asking price and market value matters here. A sale-to-list ratio measures the relationship between the original list price and the eventual sale price. It does not establish how much a home appreciated or how far its sale price exceeded comparable sales.
For a specific property, this chart is most useful alongside recent comparable sales and their original asking prices. It shows how far transactions are moving beyond their starting prices, while the comparable sales help establish the actual dollar range.
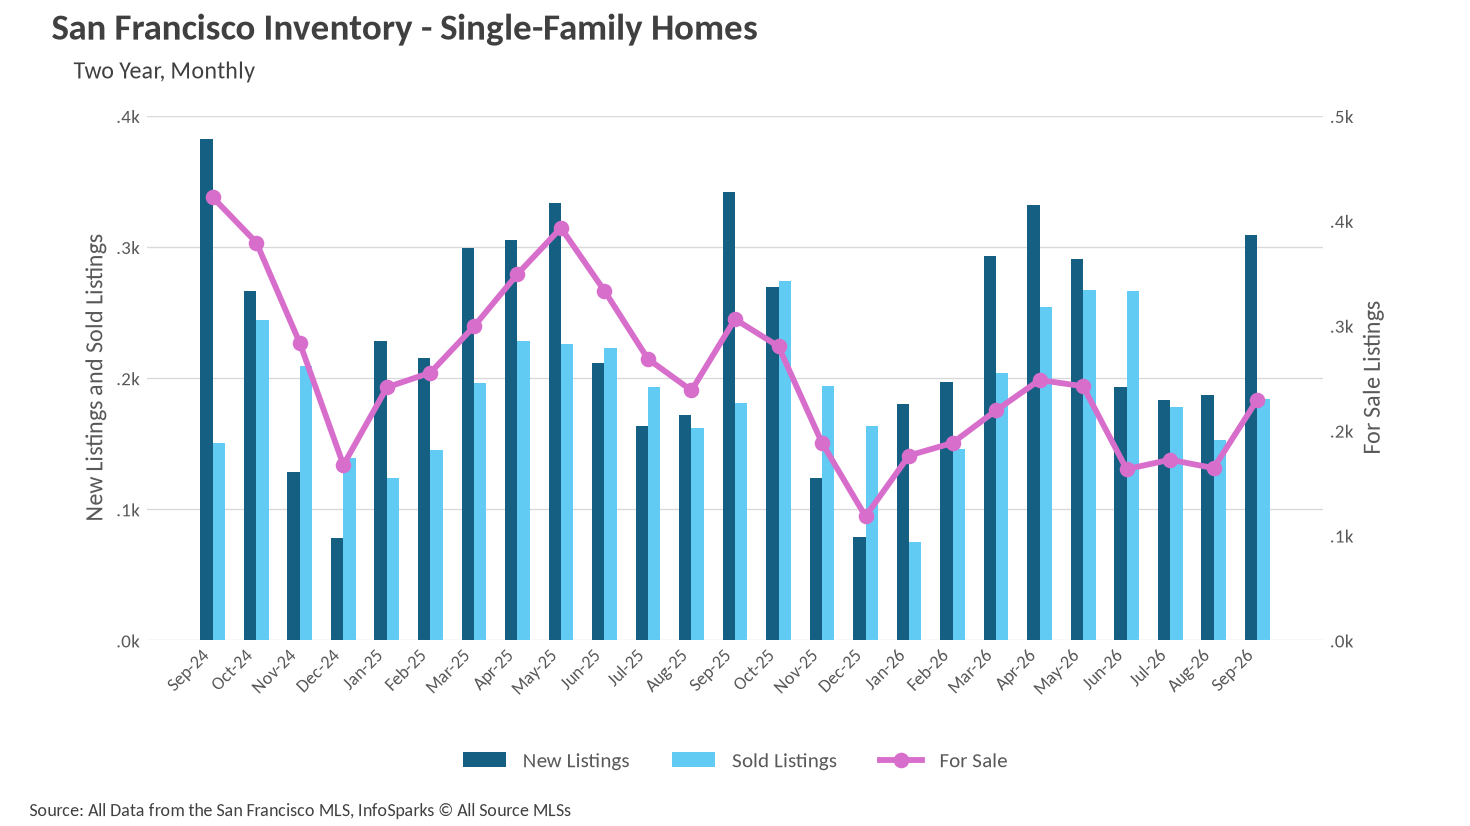
September brought 309 new single-family listings, up from 187 in August. Available single-family inventory rose from 164 to 229 homes, a 39.6% monthly increase and the highest count since April.
Yet there were still 77 fewer single-family homes available than last September. New listings also fell 9.6% year over year, while closed sales edged up from 181 to 184.
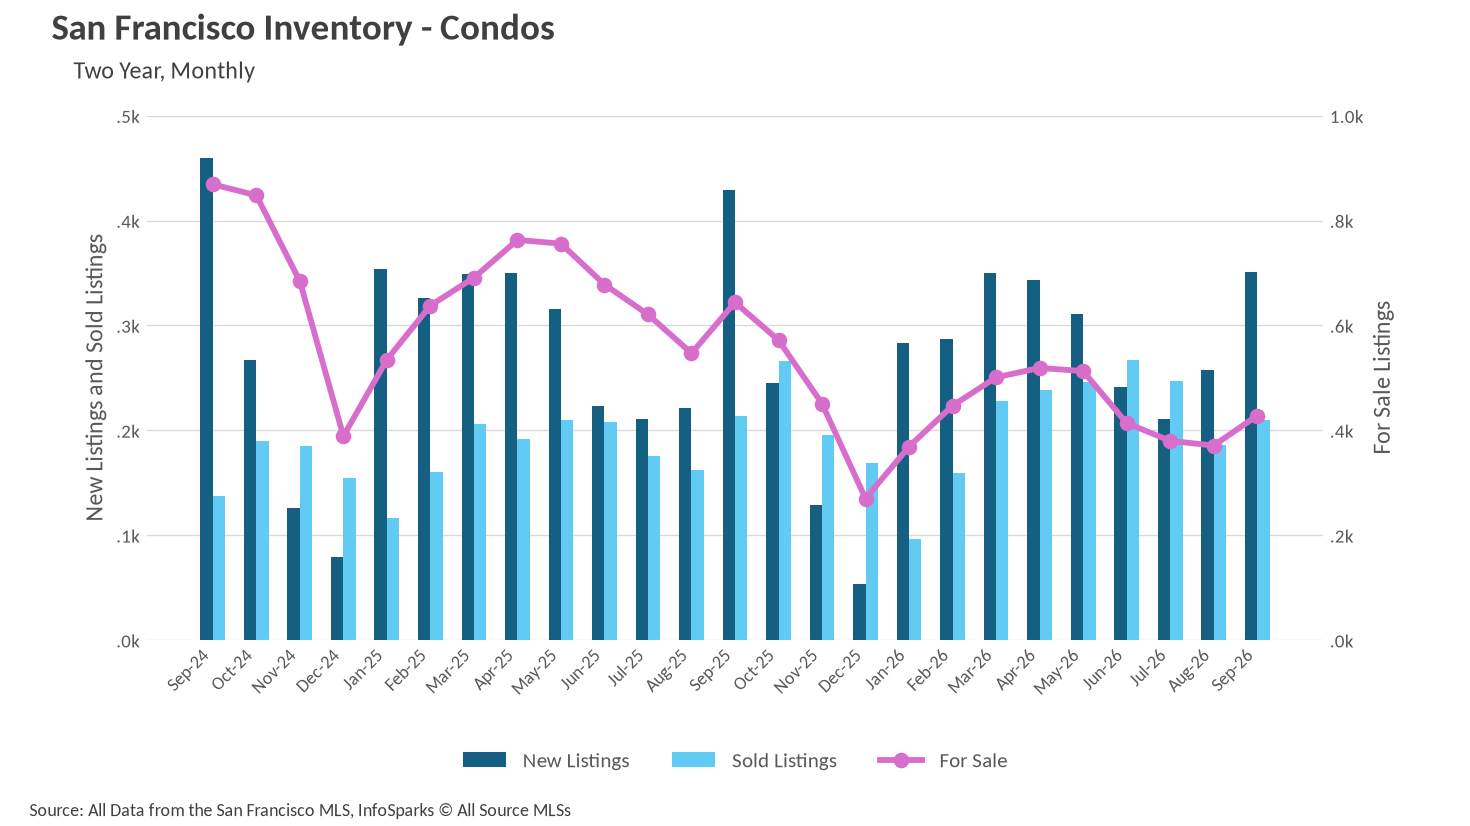
Condo inventory rose from 371 in August to 428 in September, but remained well below the 644 available a year earlier. New condo listings declined 18.2% year over year to 351, while closed sales changed little, slipping from 214 to 210.
The monthly and annual comparisons describe two different conditions: more selection than August, but about 31% fewer available homes across both property types than last September.
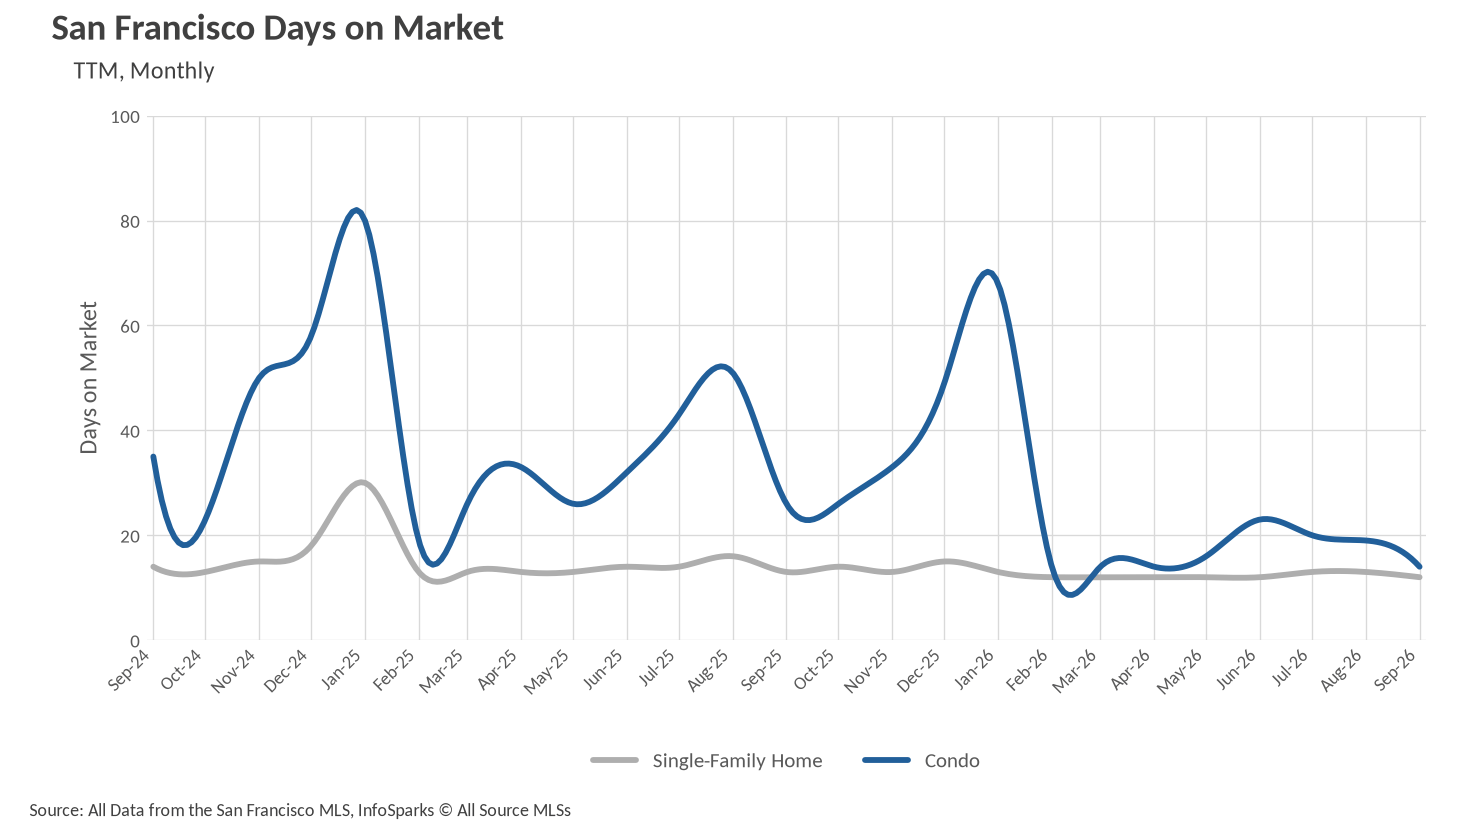
Single-family homes sold in an average of 12 days, compared with 13 days last September. That pace has stayed within a narrow 12-to-13-day range every month since February.
The larger change was in condos. Average marketing time fell to 14 days from 19 in August and 26 in September 2025, a 46.2% annual decline. September matched the fastest condo pace in this data set, previously recorded from February through April.
The longer chart makes the shift particularly clear. Condos averaged 49 days on market in December 2025 and 68 days in January 2026. By September, the gap between condo and single-family marketing times had narrowed to just two days.
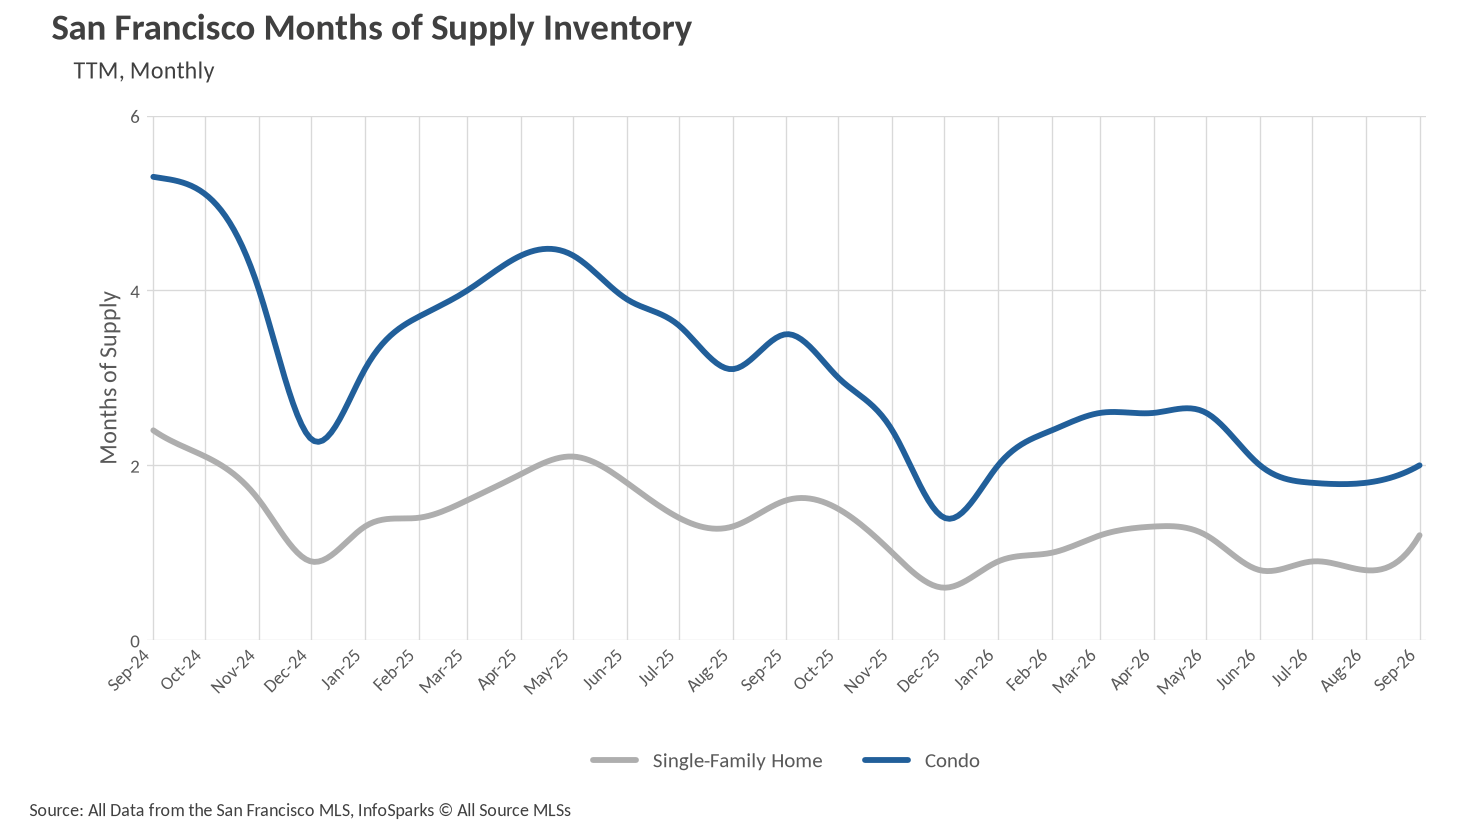
Months of supply estimates how long the available inventory would last at the current sales pace. September ended with 1.2 months of supply for single-family homes and 2.0 months for condos, compared with 1.6 and 3.5 months, respectively, a year earlier.
Both figures rose from August as fall listings arrived. Even with that increase, the annual declines in supply, short marketing times, and larger sale-to-list premiums point to conditions that continue to favor sellers overall.
The charts above let you compare September with both the summer market and prior years. For additional context, these resources provide access to the underlying report, broader housing data, and financing trends:
If you would like to examine a particular neighborhood or price range, I can pull the recent sales and active listings behind that comparison so you can see how they line up with the citywide figures.
Stay up to date on the latest real estate trends.
Market Update
Single-family prices return above $2 million, condo sales accelerate, and fall listings offer more choice within a substantially smaller pool of available homes.
Market Update
Local Demand Remains Strong as the National Market Cools
Home Sale Case Study
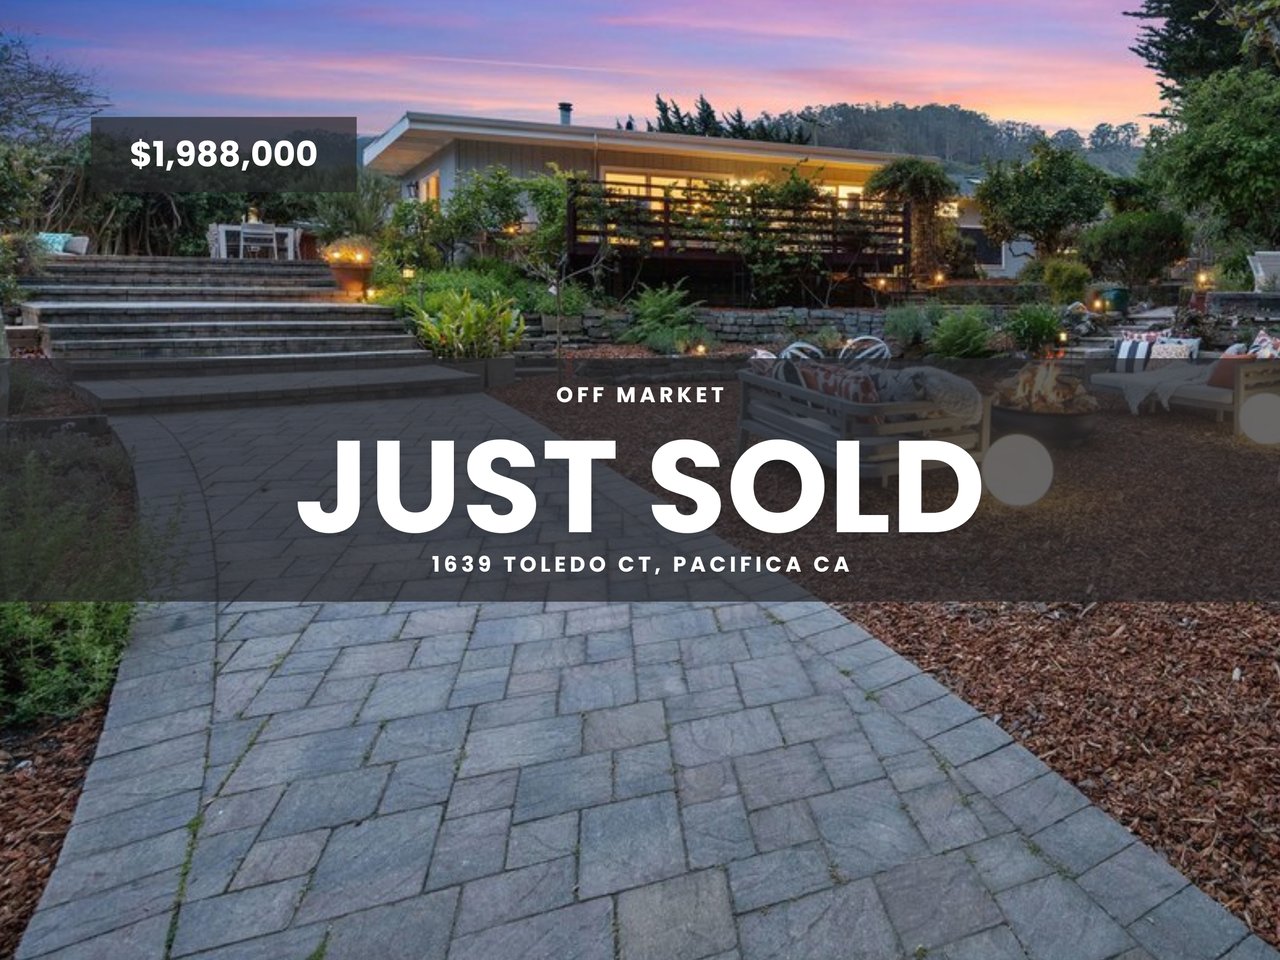
How thoughtful preparation, strategic pricing and targeted outreach connected a distinctive Pacifica property with the right buyer.
Market Update
Just 0.7 Months of Single-Family Homes for Sale

Silicon Valley
A closer look at March market trends across San Mateo, Santa Clara, and Santa Cruz counties, including home prices, inventory, days on market, and buyer demand.
Market Update
Single-family homes saw an 18.24% increase in median sale price, with the median home selling for $2,150,000.

Home Sale Case Study
How thoughtful preparation, family coordination, and strategic presentation helped this original-owner home attract 10 offers and a strong result.

Home Buyer Case Study
After months of touring homes and writing offers, one San Francisco buyer finally found the right fit in the Inner Mission.
Market Update
Home prices jumped sharply in February as inventory stayed extremely tight and buyers moved quickly across both single-family homes and condos.
You’ve got questions and we can’t wait to answer them.